
“How Do the DNA Studies Tell Us about the Routes of Human Entry into Japan?
The Holocene human fossil record supports an admixture model in which the Paleolithic population originated from both southeastern and northeastern Asia (e.g., Hanihara 1991). The mitochondrial DNA (mtDNA) analyses of modern Japanese revealed that non-African superhaplogroups M and N originally derived from modern H. sapiens dispersing out of Africa (Forster 2004) that eventually came to be the Japanese indigenous populations of Ainu and Ryukuan (e.g., Tanaka et al. 2004; cf. Maca-Meyer et al. 2001). Because Ainu and Ryukuan are descendants of the original Jomon populations (Hanihara 1991; Horai et al. 1996; Omoto and Saitou 1997) and M and N superhaplogroups represent southern and northern routes of human migrations, respectively (Tanaka et al. 2004), the Holocene Jomon population was founded by both northward and southward gene flows.
Studies of ancient mtDNA from the Jomon skeletal remains of Hokkaido show genetic relations between Jomon and Ainu, because both populations retain high frequencies of the haplogroup N9b (Adachi et al. 2011), whereas N9b is scarce among East Asian populations other than Japanese (Tanaka et al. 2004:1842) and is likely skewed to northern regions in Japan (Shinoda 2007). Because the coalescent time of N9b is estimated to be approximately 22,000 year ago (Adachi et al. 2011:355), populations that have this haplogroup emerged around the LGM. In Hokkaido, Epi-Jomon human remains in Hokkaido also have N9b (Adachi et al. 2011), which suggests some degree of gene flow during the LGM to the late Holocene in Hokkaido (22,000–2000 years ago).
As discussed above, both genetic studies based on ancient Jomon mtDNA and those based on modern mtDNA more or less support the “dual-structure model” (Hanihara 1991). This also suggests a complex population history even during the Holocene. Nevertheless, what do these genetic implications tell us about Pleistocene population migrations into Japan? In other words, what does the genetic affinity of the Jomon peoples tell us about Paleolithic population dynamics? In general, because the descendants of Jomon and Yayoi both contributed to the formation of the current Japanese population, Paleolithic foragers should be regarded as the founding population of the Jomon (Hanihara 1991). However, the extent to which Pleistocene Paleolithic populations contributed to modern Japanese is largely unidentified, mainly because there are few genetic and human fossil records, with the exception of some good fossil specimens, notably Minatogawa Man (Baba, Narasaki, and Ohyama 1998; Suzuki 1982). The remaining question is how we understand the complexity in Japanese Paleolithic population history. A question that will not be addressed here is whether there is clear evidence that the Jomon were the direct descendents of the Japanese Paleolithic foragers and whether both hunter-gatherer populations were genetically continuous for the past 30,000 years in Japan.
The Paleolithic archaeological record provides a basic picture of Pleistocene human population history in Japan. Although the number of Paleolithic sites during the 1960s was only slightly more than 300 (Ohyi 1968:52), the number of registered sites is now greater than 15,000 (Japan Palaeolithic Research Association 2010). Some clarification is necessary, however, regarding this latter number. The “sites” in the recent database include assemblages and collections of artifacts recorded in various contexts, ranging from extensively excavated sites to a few specimens collected on the surface. Because a single cultural level in a deeply excavated multilayered Paleolithic open-air site is counted as a single site, a single location was sometimes counted multiple times, and site size and artifact density from a single site are not standardized among the recorded sites. Although some bias is present in the record, the database is still useful to explore to understand general macro- and microregional patterns of human occupation across the entire Japanese Archipelago.
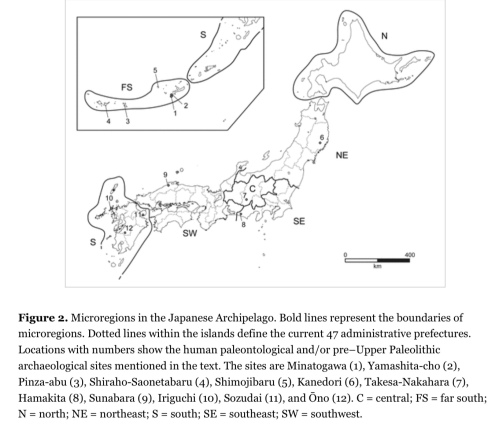
Considering the regional geographic features and Paleolithic culture history, I divided the 47 prefectures into 7 broader regions (fig. 2). From north to south, they are labeled as north (N), northeast (NE), southeast (SE), central (C), southwest (SW), south (S), and far south (FS). N, S, and FS are isolated islands corresponding to Hokkaido, Kyushu, and Ryukyu islands. NE, SE, C, and SW are the divisions of Honshu Island, the main island in the archipelago along with adjacent Shikoku. Divisions of NE, SE, C, and SW are based on the presence of mountain chains, plains, and the Pleistocene paleogeography. For example, C is the region characterized by high-altitude mountains and plains mostly above 600–1,000 m asl. SW is the region in the middle of the Pleistocene Paleo-Honshu Island. Using the site location data recorded in the database, the number of archaeological sites is counted according to the microregions (table 2). The microregions are then sorted by site density using the areal extent data announced by the Geospatial Information Authority of Japan (2015). SE is the microregion with the highest density, followed by S, C, SW, NE, N, and FS. The highest density in SE is probably explained by sampling bias, due to the high population density in the Tokyo area. It is also because the deeply excavated sites yielded multiple levels of human occupation on the Musashino and Sagamino Uplands in the southern part of SE (e.g., Yajima and Suzuki 1976; Yamaoka 2010). Except for the microregions with the highest density (SE) and lowest density (FS), the site density shows a south to north inclination. High site density in SE, followed by a gradual increase from C to SW, NE, and N, is observed. The sites are all attributed to the Pleistocene, whereas the chronological affiliations of these sites vary depending on the region, especially between N (the southern part of Paleo-SHK) and the rest of the microregions (i.e., Paleo-Honshu and Ryukyuan islands). The Paleolithic in the Paleo-Honshu record started at the beginning of the Upper Paleolithic, around 40,000–37,000 years ago, and ended around 11,500 years ago (Yamaoka 2010; Yoshikawa 2014), whereas the beginning of the Paleolithic record in Hokkaido is not earlier than 30,000 years ago (Izuho et al. 2012; Naoe and Kudo 2014). Thus, the time depth of the Paleo-Honshu Paleolithic record is approximately 27,000 years, as opposed to 18,500 years for Paleo-SHK, because the reliable dates obtained from the hearths in the Agonki-5 site in Sakhalin are 23,500 years ago (Kuzmin et al. 2004; Vasilevski 2003). Because of the difference in time depths, the south to north inclination of site density implies that the earlier Paleolithic sites are more abundant in southern Japan than in northern Japan. High site density in the S microregion (Kyushu) next to the SE of the southern Kanto region in Honshu suggests that waves of the earlier hunter-gatherers would have migrated into Kyushu and spread to the north along Paleo-Honshu Island. Conversely, the likelihood of earlier human population migrations in the early Upper Paleolithic (EUP) from eastern Siberia via Paleo-SHK is not supported. On the one hand, site density patterns alone do not answer the question of timing and size of northerly migratory populations from Paleo-Honshu to Paleo-SHK. The lowest density of the FS microregion of the Ryukyu Islands suggests that human arrivals into the Ryukyu Islands were relatively low and that occupations were not necessarily continuous, unlike the situation in the microregions in Paleo-Honshu. Relatively high site density in C (the central region in Paleo-Honshu) suggests that humans occupied high-elevation regions during the Upper Paleolithic. Good examples are represented by the open-air sites located on the Nobeyama Plateau, where Paleolithic hunter-gatherers could have followed seasonal movements between the central highlands and southern Kanto regions in SE (e.g., Tsutsumi 2011), similar to pastoral transhumance (e.g., Chang and Tourtellotte 1993), and where groups of hunter-gatherers seasonally aggregating to kill large herbivores around lakes would have sometimes succeeded (e.g., Norton et al. 2010b). Given the population entry routes (fig. 1), the observed south to north inclination of site density in the Paleo-Honshu suggests that the majority of Paleolithic migratory groups were from the Korean Peninsula and southern China. If so, routes 1 and 5 are the best-supported routes for early hunter-gatherers’ dispersals into the Japanese Archipelago.


Table 2. Counts, areal extent, and density of Late Pleistocene sites in Japan
- Go toIn the study of population history, an establishment of cultural chronology is one of the major debated areas of research among the other topics in Paleolithic studies in Japan. Below, I give an overview of the long-term and short-term chronologies and discuss how both chronological models are relevant to global models of human population migrations and dispersals in Eurasia.
Clear evidence of the Japanese Paleolithic appears beginning around 40 ka, and blade technology was incorporated since the earliest lithic assemblages appeared in the southern Kanto region in the SE microregion (Yamaoka 2010; but see Nakamura 2012). The gradual but consistent increase in the number of blade tools (e.g., endscrapers, burins, and perforators) and various blade-production technologies, including prismatic blade technology, which certainly spread across Japan during the Upper Paleolithic, suggests that the technology of the Japanese Upper Paleolithic is not dissimilar to that of the Upper Paleolithic in Europe. On the contrary, unique stone tools characterized in the Japanese EUP are principally represented by three classes of stone tools (fig. 3): trapezoids defined as abruptly and/or minimally retouched small flakes (Sato 1988), backed blades (Ono 1988) characterized by abrupt retouches and truncations on elongated flakes and/or blades traditionally described as knife-shaped tools (Serizawa 1960; Sugihara 1965; Tozawa 1990), and edge-ground axes (Tsutsumi 2012). The combination of trapezoids, knife-shaped tools, and edge-ground axes in EUP is unique to the Japanese Paleolithic industry, and they have not been recovered together in neighboring regions, such as South Korea (K. Bae 2010; Lee, Bae, and Lee 2016), which suggests that they were newly innovated in Japan at the beginning of the Upper Paleolithic; however, edge-ground stone axes attributed to MIS 3 have recently been identified at the Galsanri and Yonghodong sites in Korea (Lee, Bae, and Lee 2016). Indeed, knife-shaped tools long persisted as the formal stone tool class in the Japanese lithic industries, and the “knife-shaped tool culture” is the technocomplex that is extensively distributed from Kyushu to southern Hokkaido (e.g., Ambiru 1986; Morisaki 2012; Naganuma 2010; Ono 1988; Yoshikawa 2010). In the Korean Peninsula, the Upper Paleolithic industry has tanged points (Seumbe Chireugae) from its initial stage with the emergence of blade technology (C. Bae 2017, in this issue; K. Bae 2010; Lee 2015, 2016; Seong 2008, 2009; Seong and Bae 2016). Tanged points also appeared in Japan in the late Upper Paleolithic, around 30,000 years ago, mainly in the Kyushu region; however, they occur rather briefly, perhaps in response to small-scale human migrations from Korea or cultural transmission after the collapse of the regional environment in Kyushu, caused by the large explosive event of the Aira Volcano, which occurred some 30,000 years ago (Matsufuji 1987; Morisaki 2015). The traits shared between the retouch technologies used in the Japanese knife-shaped tools and the Korean tanged points make archaeologists hypothesize that an immediate technological transmission of tanged points from Korea to Japan at the beginning of the Upper Paleolithic stimulated the invention of knife-shaped tools (Ambiru 2010), which could be evidence of foraging groups migrating to Kyushu from the Korean peninsula (C. Bae 2017, in this issue; Matsufuji 1987).
 Figure 3. Examples of the major stone tools from the early Upper Paleolithic assemblages. 1–6 = trapezoids; 7 = a flake core with small flake scars served for blanks of trapezoids; 8–11 = knife-shaped tools (backed blades); 12–13 = edge-ground axes. Tools 1–3 and 8 are from Jizoden (Kanda 2011). Tools 4–7, 12, and 13 are from Hinatabayashi B (Tani 2000). Tools 9 and 10 are from Happusan (Suto 1999). Tool 11 is from Nawateshita (Yoshikawa 2006).
Chronometric dates, mostly radiocarbon dates based on associated charcoal, demonstrate that the lithic industry characterized by a composite of trapezoids, knife-shaped tools, and edge-ground axes appeared in Japan at 40,000 to 38,000 years ago (Izuho and Kaifu 2015; Tsutsumi 2012; Yamaoka 2010). A substantial number of EUP assemblages (∼500) dated to 38,000 to 30,000 years ago further indicate that modern H. sapiens migrated into the Japanese Archipelago around 40,000 years ago, bringing the new lithic technological complex (Izuho and Kaifu 2015). Culture-chronological division between the Early and Late Paleolithic to characterize lithic industries in East Asia (Gao and Norton 2002; Ikawa-Smith 1978; Seong and Bae 2016) may also be validly applicable to the current Japanese Paleolithic record, although it is necessary to address the question of whether there was Paleolithic human occupation before 40 ka and, if there was, how the earlier Paleolithic record is related to other East Asian Paleolithic records, notably those in China and Korea.
The possibility of an archaeological record before 40 ka was largely dismissed when the Early Paleolithic hoax was exposed in 2000. At that time, it was shown conclusively that the Early and Middle Paleolithic stone tool industries from Miyagi Prefecture were all faked by an amateur archaeologist beginning in the 1980s (Nakazawa 2010; Yamada 2001). Before the fakes were produced, however, the reality of an Early Paleolithic in Japan had been seriously discussed for several sites, such as Sozudai in northern Kyushu and Hoshino in Honshu (Serizawa 1971; Yanagida and Ono 2007). The debate regarding the reality of the Early Paleolithic industry was largely over the issue of whether the fractured flakes were man-made artifacts or not (i.e., geofact). Quaternary geologists suggested that the geological layers of “archaeological artifacts” were derived from alluvial/colluvial sediments that could have created naturally fractured cobbles to make flake-like geofacts (Arai 1971). In contrast, a systematic examination of the angle between the striking platform and the ventral surface of flakes from the pre-40 ka level in the Sozudai site suggested that they were man-made (Bleed 1977), which was largely supported by the proponents of the long-term chronology in the Japanese Paleolithic (Serizawa 1982). Although debate over these sites was shelved while the sensational finds were being “discovered” in Miyagi Prefecture, since the hoax was exposed, many of these sites have subsequently been revisited (e.g., Hagiwara 2006; Ikawa-Smith 2016; Matsufuji 2010; Naruse 2010; Sato 2016; Wada 2016). The candidate assemblages for occupation of the archipelago before the Upper Paleolithic are Kanedori (Tohoku region, NE), Takesa-Nakahara (central Japan, C), Sunabara (southwestern Honshu, SW), and Iriguchi (northern Kyushu, SW; see fig. 2). Multiple criteria have been employed to assign them to before the Upper Paleolithic. First, flaking and retouch technologies have been used. Besides mechanical criteria to distinguish flakes from geofacts (Barnes 1939; Bleed 1977), a peculiar flaking technology called “obtuse angle technology” (Nagai 2011) that is often found in spheroids in the “Lower/Middle Paleolithic” industry in South Korea (Lee 2015) is chosen. The second criterion is whether these stone tools are really different from or similar to the earliest Upper Paleolithic assemblages (i.e., edge-ground axes, knife-shaped tools, and trapezoids) with respect to patterns in tool morphology, reductive technology, and raw material use (e.g., Matsufuji 2010; Suto 2006). For example, Matsufuji (2010:196) suggests that crude and large tools with two small flakes recovered from the Kanedori IV layer are different from the EUP industry, and therefore it is attributed to the “broader East Asian core and flake tool tradition.” The third criterion is the chronological age of the assemblage. Instead of using chronometric dates associated with tool assemblages from before the Upper Paleolithic, Japanese Paleolithic archaeologists have usually employed tephras to develop culture-stratigraphic sequences.
Based on the above multiple criteria, most of the Japanese assemblages from before the Upper Paleolithic cannot support the arrival of humans before 40 ka. However, some recently excavated sites, notably Sunabara, have been investigated through examination of site integrity (Matsufuji and Uemine 2013; Uemine, Matsufuji, and Shibata 2016) and microscopic analysis of fracture mechanics in rhyolite (a coarse-grained material recovered from the site) to identify the man-made nature of lithic artifacts (Uemine 2014). These efforts may eventually stand up to further scientific scrutiny to support an MIS 5e human arrival in the archipelago, as some researchers propose. However, in a case like Sunabara, researchers will be further required to explain how man-made “artifacts,” naturally fractured debris, and naturally transported pebbles were all recovered together in the same alluvial sediments (i.e., layer VIa; Uemine 2014). Only a thorough analysis of the site formation processes may really answer this question.
Among the other artifacts, the lithic assemblages from Kanedori layers IV and III are the most promising lithic artifacts attributable to before the Upper Paleolithic in Japan (Kuroda et al. 2005, 2016; Matsufuji 2010). The lower level of Kanedori layer IVb, where the lower assemblage was recovered, has multiple tephras that were secondarily deposited, suggesting that the age of layer IVb is in the time range of 50,000 to 90,000 years ago (Soda 2005; Yagi 2005). Despite the seeming credibility of stratigraphy, lithic artifacts, and tephra-assisted chronometric dates in the Kanedori assemblages from before the Upper Paleolithic, the number of candidates for Japanese lithic assemblages from before the Upper Paleolithic is still small. Even among the 16 so-called assemblages, there are surface collections (e.g., Kaseizawa) that are undateable (Sato 2016:31, table 1). More detailed evaluation of the characteristics and variability in those assemblages requires further systematic comparison through technological and morphological studies (e.g., Bleed 1977; Nagai 2011). Given the sporadic and sparse occurrence of those candidates for sites from before the Upper Paleolithic, categorizing them into the notion of the “Early Paleolithic” and the extent to which they are comparable to the archaeological record in the East Asian mainland (e.g., Gao 2013; Gao and Norton 2002; Wang 2005) will be an important future research avenue.
- How much do we know about the Pleistocene human population history in Japan, and how much do we not know? With respect to human migratory routes into the Japanese Archipelago, of the six hypothesized routes of human entry (fig. 1), the routes from the Korean Peninsula and southern China to Kyushu (i.e., routes 1 and 5), a southern part of Paleo-Honshu Island, are the most parsimonious based on the Paleolithic site density and technological and morphological comparisons of formal stone tools between Japan and Korea during the EUP. This route was likely, given that hunter-gatherer population density in the adjacent regions would have been higher than Paleo-Honshu at the time of the earliest population entry. For example, researchers have identified an increasing number of Middle and Late Pleistocene sites in southern China (e.g., Pei et al. 2013; Shen and Keates 2003; Wang 2003, 2005; Wei et al. 2017), suggesting that the Late Pleistocene hunter-gatherer population density in southern China was higher than that in Paleo-Honshu. In contrast with the extensive Paleolithic record in Japan, the Pleistocene human fossil record is primarily concentrated in the Ryukyus. This implies that Upper Paleolithic hunter-gatherers had already migrated into the far southern Japanese islands by seafaring, although the migratory route to get to the Ryukyus is still not clear. It is possible that the initial foragers to arrive in the Ryukyus came from Taiwan in the south (Kaifu et al. 2015) or from southern Kyushu in the north. The latter route was present at least during the Holocene (Obata, Morimoto, and Kakubuchi 2010; Yamazaki 2012). To further complicate the various migration models, ancient DNA data largely support gene flow from eastern Siberia to Hokkaido, possibly since the LGM. If this were the case, Pleistocene population dynamics were more complex than the admixture model, which assumes population continuity from the Paleolithic to Jomon, followed by the admixture of late Holocene Yayoi peoples, as outlined in the dual-structure model (Hanihara 1991).A more complex picture of Pleistocene hunter-gatherer migrations into the Japanese Archipelago is legitimately implied from the long- and short-term chronologies of the Japanese Paleolithic record. In the framework of the long-term chronology, the question is the extent to which human populations before the Upper Paleolithic (>40 ka) contributed to the establishment of subsequent hunter-gatherer populations since 40 ka. Regardless of the relationship between populations, given the scarce evidence of credible human occupations before 40 ka, which has so far only been provided from a small number of archaeological sites (e.g., lithic industry from the Kanedori before 50 ka), the human population size before 40 ka in Japan was smaller than that of the Upper Paleolithic. In stone tool technology, although it could be an effect of small sample size (n = 40), there seems to have been a change from the unstandardized retouched tools and heavy-duty tools in the industry before 40 ka, as represented by the Kanedori III assemblage, to the formal and standardized stone tool inventory consisting of trapezoids, knife-shaped tools, and edge-ground hand axes in the EUP. This change further suggests that the EUP tool inventory and technology were independently invented among hunter-gatherers before the Upper Paleolithic. In contrast, the currently dominant short-term Paleolithic chronology may pose a different explanation for technological change. In the short-term chronology, the EUP hunter-gatherers were the first population to enter into the Japanese Archipelago. In this context, the EUP tool inventory and blade technology were all brought into Japan, and the subsequent proliferation was the result of relatively rapid population expansion across the archipelago (i.e., demic expansion; Cavalli-Sforza, Menozzi, and Piazza 1993). The Upper Paleolithic demic expansion in Japan syncs well with the modern Homo sapiens single-dispersal model out of Africa and rapid dispersal into South Asia (e.g., Forster and Matsumura 2006; Mellars 2006a, 2006b). However, Upper Paleolithic lithic industries that appear after the end of the EUP (∼30,000 years ago) exhibit extensive regional variation, particularly in the technological, morphological, and stylistic characteristics of the complexes represented by the knife-shaped tools (e.g., Morisaki 2012; Ohyi 1968; Yoshikawa 2010), bifacial points (e.g., Hashizume 2015), and microblade cores (e.g., Sato and Tsutsumi 2007). The observed variation might have been created by a combination of human migrations from the East Asian mainland and endemic technological invention and transformation among Upper Paleolithic hunter-gatherers between the different microregions in the Japanese Archipelago. The interactions and foraging across the boundaries of microregions are often perceived in archaeological patterns, including the long-distance transportation of obsidian (e.g., Tsutsumi 2010) and isolated occurrences of regionally stylistic weapons outside of their core areas, such as the Kou-type knife-shaped tools (e.g., Kato 1975; Morisaki 2012). Moving forward, it will be critical to evaluate the extent to which indigenous hunter-gatherer population density at the microregional scale and the size of populations dispersing from the East Asian mainland covaried and influenced cultural change and variation on the archipelago. Given the complex nature of the Paleolithic archaeological record, human occupation history in Japan is likely compatible with a multiple-dispersal model of H. sapiens (e.g., Bae and Bae 2012; Boivin et al. 2013; Lahr and Foley 1994; Petraglia et al. 2010).
What makes the population history in Japan complicated is that the migration from the north via Paleo-SHK was significantly later than for Paleo-Honshu. While a small number of trapezoids that are morphologically comparable to those of the EUP in Paleo-Honshu have been identified in some assemblages in eastern Hokkaido, allowing some archaeologists to place them in late MIS 3 (e.g., Izuho and Takahashi 2005; Oda and Morisaki 2016), archaeological assemblages from the sites having secure associations of chronometric dates and stratigraphy in Hokkaido only appear at the onset of the LGM, 25,000 years ago (Izuho et al. 2012). Flake technology, blade, and microblade technologies were incorporated into the LGM technocomplex in Hokkaido (Izuho et al. 2012; Nakazawa and Izuho 2006, Nakazawa et al. 2005), which later converged into the microblade technocomplexes (Nakazawa and Yamada 2015). This development likely resulted from a combination of independent innovation, cultural transmission, and demic expansion from eastern Siberia and Paleo-Honshu in and after the LGM (e.g., Buvit et al. 2016; Graf 2009; Nakazawa et al. 2005; Nakazawa and Yamada 2015). Why the initial occupation of Paleo-SHK lagged behind that of Paleo-Honshu by some 15,000 years is another area that needs to be further investigated.
Although the number of migratory events is difficult to tease out from the current archaeology, human paleontology, and human genetic records, it is likely that it was the result of the admixture of two opposite large migratory events, similar to the Korean Upper Paleolithic (K. Bae 2010; Bae and Bae 2012). This population admixture likely occurred during MIS 2 (30,000 to 11,500 years ago) and involved an influx of hunter-gatherers from the north and south. Evident increases in the number of sites and stone tool technological variability during MIS 2 in both Paleo-Honshu and Paleo-SHK (e.g., Nakazawa and Yamada 2015; Ono et al. 2002; Suto 2006) could be explained by demographic increase and an associated cumulative adaptive culture model (e.g., Henrich 2004; Shennan 2001; Powell, Shennan, and Thomas 2009, 2010).
An examination of current evidence in Paleolithic archaeology, human paleontology, and human genetics in Japan necessarily provides a complex picture of Late Pleistocene demographic history. In the vast region of Asia, describing the Pleistocene population history in the Japanese Archipelago will doubtlessly be important in understanding human colonization and evolutionary history. Moreover, the accumulated Paleolithic record in Japan has the potential for improving understanding of the complexity of Pleistocene hunter-gatherer cultural and biological evolution.”
